El Nino
Everybody wants to know what the weather is going to do each day -- and with good reason, considering the many destructive storms and tornadoes that have hit the U.S. recently. In 1997-1998, the weather effect known as El Niño has been a favorite topic of conversation, as it seems to have caused most of those weather woes. But just what is El Niño? It's a periodic disruption of the Pacific's climatic system.
|

Usually, trade winds blow west across the Pacific, causing warmer ocean waters to "pile up" in the west: near Indonesia, the sea's surface is actually about a foot and a half higher than it is near Ecuador. However, on a cyclical basis, the trade winds die down, disrupting this normal pattern. The warmer waters stay east, raising the water temperature, rather than migrating west. This changes atmospheric circulation and weather patterns around the globe -- what we call El Niño.
Many places have seen extra rain in 1998. This El Niño has had some notable effects. Rainfall in southeast Asia was far below normal in 1997-1998, while rainfall along the Pacific coast of South America was much higher than normal. North America, Europe, and east Asia saw higher than normal temperatures. California was hard hit by El Niño storms. Elsewhere in the world, dry conditions fostered severe forest fires and ongoing haze conditions.
In Peru, one of the hardest-hit areas, torrential rains have triggered floods and mudslides, washing away homes, farms, bridges, and highways. Floods have even uprooted a cemetery in Trujillo, sending coffins floating down the street. Marine mammals from whales to otters have been especially battered. They survive on prey that breeds in cool, nutrient-rich waters, and the changes in water temperatures have made it difficult for them to find food. In Peru, 180,000 sea lions once lived along the coast, but just 30,000 now remain. The rest have died or migrated in search of food.
What's in a name? The term "El Niño," which refers to the Christ child, was given to this weather pattern by Peruvian fishermen who noticed that warm currents arrived one year at Christmastime. On average, El Niño occurs every two to seven years.
What causes El Niño?
Usually, the wind blows strongly from east to west along the equator in the Pacific. This actually piles up water (about half a meter's worth) in the western part of the Pacific. In the eastern region, deeper water (which is colder than the sun-warmed surface water) gets pulled up from below to replace the water pushed west. So, the normal situation is warm water (about 30 C) in the west, cold (about 22 C) in the east.
During an El Niño period, the winds pushing that water around weaken. As a result, some of the warm water piled up in the west slumps back down to the east, and not as much cold water gets pulled up from below. Both these tend to make the water in the eastern Pacific warmer.
But it doesn't stop there. The warmer ocean water then affects the winds by lessening their strength! So if the winds get weaker, then the ocean continues to get warmer. This positive feedback is what makes El Niño grow.
La Nina
La Niña is characterized by unusually cold ocean temperatures in the eastern equatorial Pacific, as compared to El Niño, which is characterized by unusually warm ocean temperatures in the Equatorial Pacific.
|

Previous Cold Phases:
La Niñas occurred in 1904, 1908, 1910, 1916, 1924, 1928, 1938, 1950, 1955, 1964, 1970, 1973, 1975, 1988, 1995
Typical La Niña Impacts:
La Niña tends to bring nearly opposite effects of El Niño to the United States — wetter than normal conditions across the Pacific Northwest and dryer and warmer than normal conditions across much of the southern tier. The impacts of El Niño and La Niña at these latitudes are most clearly seen in wintertime. In the continental U.S., during El Niño years, temperatures in the winter are warmer than normal in the North Central States, and cooler than normal in the Southeast and the Southwest. During a La Niña year, winter temperatures are warmer than normal in the Southeast and cooler than normal in the Northwest.
Tropical Weather
The tropics can be defined as the area of the Earth found between the Tropic of Cancer (23.5° North) and the Tropic Capricorn (23.5° South). In this region, the Sun will be directly overhead during some part of the year. The temperature of the tropics does not vary much from season to season because high quantities of solar insolation are received here regardless of the time of the year. Weather in the tropics is dominated by convective storms that develop mainly along the intertropical convergence zone (ITCZ), the subtropical high pressure zone, and oceanic disturbances in the trade winds that sometimes develop into hurricanes.
One of the most important weather features found in the tropics is the intertropical convergence zone. The intertropical convergence zone is distinguished by a wide band of cumulus and cumulonimbus clouds that are created by dynamic atmospheric lifting due to convergence and convection. In general, the intertropical convergence zone delineates the location where the noonday Sun is directly overhead. Because of the high Sun, the intertropical convergence zone receives the greatest quantity of daily solar insolation in the tropics. At the intertropical convergence zone, this energy is used to evaporate large amounts of water and is converted into sensible heat at the ground surface and within the atmosphere. Often, these processes lead to an almost daily development of convective thunderstorms by providing moisture and heat for the development of cumulonimbus clouds. The intertropical convergence zone also represents the location of convergence of the northeast and southeast trade winds. The convergence of these wind systems enhances the development of convective rain clouds at the tropics.
The intertropical convergence zone moves seasonally with the tilt of the Earth's axis. The convective rains that accompany the passage of the intertropical convergence zone are the primary source of precipitation for locations roughly 10 to 23.5° North and South latitude. Figure 7u-1 describes the seasonal movement of the intertropical convergence zone and other systems associated with our planet’s global circulation.
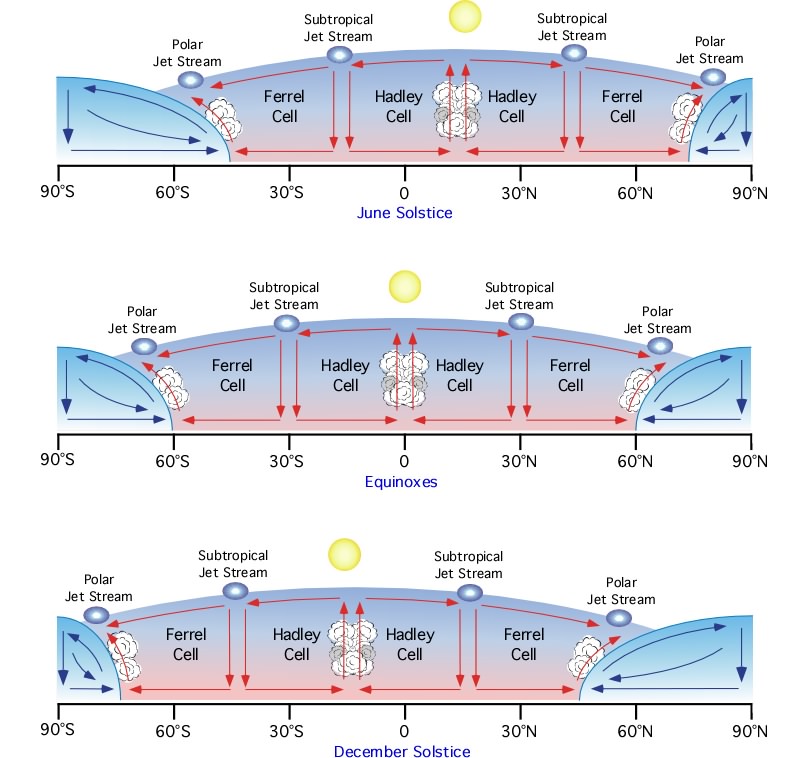
Figure 7u-1: Seasonal movement of the Earth's global circulation patterns. The major circulation cells are identified on the “Equinox” figure. In the “Equinox” figure, the intertropical convergence zone (ITCZ) occurs at the equator where the Trade Winds converge creating a low-pressure center and updrafts (red arrows). The upward movement of the moist tropical air above the intertropical convergence zone produces a band of thunderstorm activity that brings precipitation to the tropics. At the zone where the Hadley Cell and Ferrel Cell meet, tropospheric airflow is in a downward direction moving from the top of the troposphere to the Earth’s surface (green arrows). These downdrafts give rise to the subtropical high-pressure zone on the Earth’s surface. Surface air also moves upward into the troposphere at the boundary between the Ferrel Cell and the Polar Cell. At this location, frontal lifting associated with mid-latitude cyclones moves warm subtropical air over cold polar air producing clouds and precipitation. Note how the Earth’s circulation patterns change their position in the December and June solstice figures. |
The other important weather feature in the tropics is the subtropical high-pressure zone. Airflow in the subtropical high-pressure zone is primarily descending. This creates clear skies, low humidity, and hot daytime temperatures. Like the intertropical convergence zone, the subtropical high-pressure zone migrates seasonally (see Figure 7u-1). It generally influences locations 10 to 23.5° North and South during some part of the year.
Easterly Waves
Weather disturbances in the trade winds, known as easterly waves, are another source of cloud development and precipitation in the tropics. Easterly waves develop first as a weak disturbance in the atmosphere, usually because of the presence of localized warmer ocean temperatures. On a weather map these weather systems appear as a wave in the isobars (Figure 7u-2). On the eastern side of this wave, convergence occurs forming numerous thunderstorms (divergence occurs on the western side). If the convergence is strong enough, the storm system may intensify and organize into a hurricane. On average, about 10% of the weather disturbances associated with easterly waves develop into hurricanes.
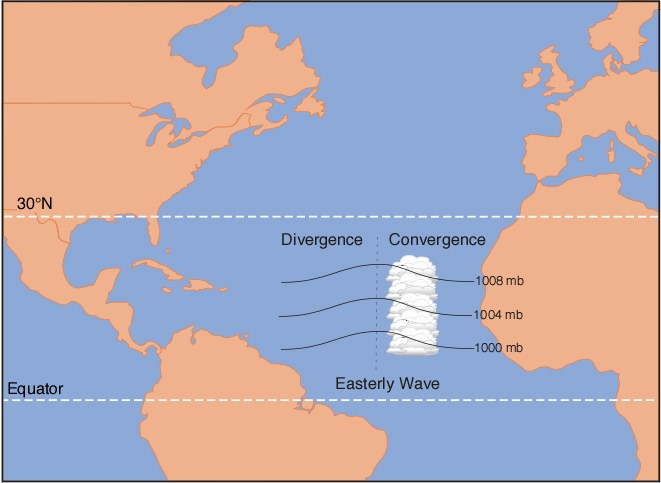
Figure 7u-2: Most tropical storms develop from a weather feature known as an easterly wave. On weather maps, these features appear as a “wave” in the isobars (lines of equal pressure) that travel from east to west. Numerous thunderstorms form on the East side of the easterly wave because of convergence. If this mass of thunderstorms develops cyclonic airflow a hurricane often forms. |
Hurricanes
Hurricanes are intense cyclonic storms that develop over the warm oceans of the tropics (Figure 7u-4). These tropical storms go by other names in the various parts of the world: India/Australia - cyclones; western North Pacific - typhoons; and the Philippines - baguio. By international agreement, the term tropical cyclone is used by most nations to describe hurricane-like storms that originated over tropical oceans. Surface atmospheric pressure in the center of a hurricane tends to be extremely low. The lowest pressure reading ever recorded for a hurricane (typhoon Tip, 1979) is 870 millibars (mb). However, most storms have an average pressure of 950 millibars. To be classified as a hurricane, sustained wind speeds must be greater than 118 kilometers per hour at the storm's center. Wind speed in a hurricane is directly related to the surface pressure of the storm. The following graphFigure 7u-3) shows the relationship between surface pressure and sustained wind speed for a number of tropical low pressure systems. (
Figure 7u-3: Relationship between surface pressure and wind speed for a number of tropical lowpressure systems. Tropical low pressure systems are classified as hurricanes when their pressure is 980 millibars or lower, and sustained wind speeds are greater than 118 kilometers per hour. |
Hurricanes have no fronts associated with them like the mid-latitude cyclones of the polar front. They are also smaller than the mid-latitude cyclone, measuring on average 550 kilometers in diameter. One of the largest hurricanes ever measured was Typhoon Tip (October 12, 1979) which had a diameer of about 2100 kilometers. Mature hurricanes usually develop a cloud-free eye at their center (Figure 7u-4 and 7u-5). In the eye, air is descending creating clear skies. The eye of the hurricane may be 20 to 50 kilometers in diameter. Surrounding the eye are bands of organized thunderstorm clouds formed as warm air move in and up into the storm (Figure 7u-6). The strongest winds and heaviest precipitation are found in the area next to the eye where a vertical wall of thunderstorm clouds develops from the Earth's surface to the top of the troposphere.
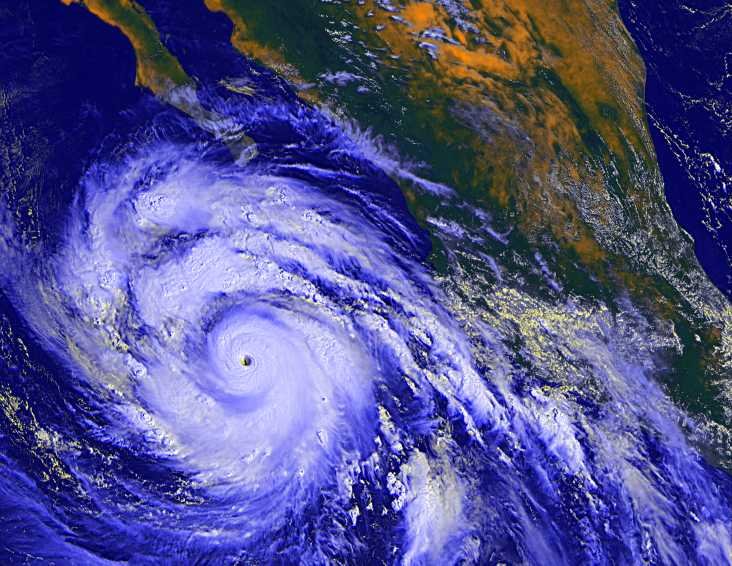
Figure 7u-4: Hurricane as seen from the space shuttle (Source: NASA).
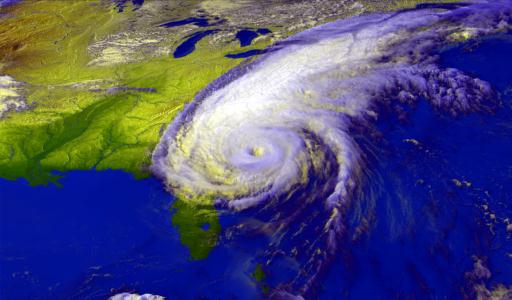
| Figure 7u-5: Satellite view of hurricane Floyd just before it made landfall in North Carolina, September 15, 1999. Notice the eye is clearly visible in this image (Source: NASA). |
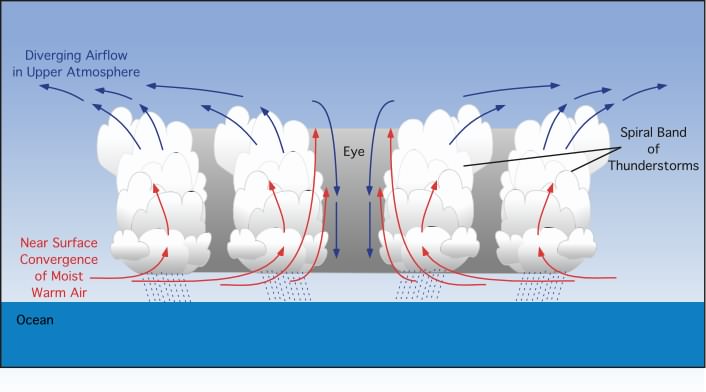
| Figure 7u-6: Graphical model showing a vertical cross-section of the air circulation, clouds, and precipitation associated with a hurricane. |
Hurricane Development, Movement, and Dissipation
Hurricanes are powered by the latent heat energy released from condensation. To form and develop, they must be supplied with a constant supply of warm humid air for this process. Surface air with enough energy to generate a hurricane only exists over oceans with a temperature greater than 26.5° Celsius (80° F). Further, this warm surface water must exist in a layer that is at least 200 meters (600 feet) deep. Ocean temperatures this high only occur in selected regions of our planet and during particular seasons. Hurricane development can also be prevented by the presence of a temperature inversion in the atmosphere. Inversions develop in the tropics when subtropical high pressure systems produce sinking air.
Hurricanes go through a number of different stages of development. Initially, these powerful storms begin their lives as a group of unorganized thunderstorms that develop over the specific areas of the tropical oceans. However, not all of these types of tropical disturbances become hurricanes. To develop into a hurricane, significant cyclonic circulation must occur around the disturbances. This type of circulation enhances the development of the group of thunderstorms by providing additional moisture and latent heat energy. With more moisture and latent heat energy, the strength and number of the thunderstorms in the tropical disturbance increases causing the disturbance to intensify. The thunderstorms also begin to organize themselves into spiral bands that swirl cyclonically toward the center of the storm. If the sustained wind speed around the disturbance increases to between 37 and 63 kilometers per hour (23 to 39 miles per hour), the storm becomes classified as a tropical depression. Tropical depressions appear on the weather map as a cyclonic low with several closed isobars circling the storm's center. A tropical depression can continue to intensify and become a tropical storm, the next stage in hurricane development. Tropical storms have a lower central pressure, several more closed isobars on a weather map, and winds that are between 64 and 118 kilometers per hour. Finally, tropical storms officially become hurricanes when their sustained wind speed exceeds 118 kilometers per hour.
Figure 7u-7 shows the tropical and subtropical ocean areas where hurricanes typically form on our planet. These areas generally extend poleward to a maximum latitude of about 25 to 30° North or South. The exclusion of hurricanes from around the equator is related to the fact that Coriolis force is almost negligible here. A specific threshold quantity of Coriolis force is required to initiate cyclonic flow. Note that hurricanes do not form over the southeastern Pacific Ocean, South Atlantic Ocean, and off the coast of northern Africa. In these regions, cool ocean temperatures or the presence of temperature inversions restrict formation.
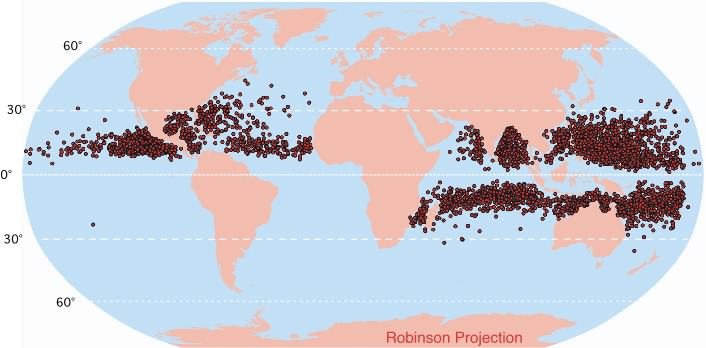
| Figure 7u-7: Locations where hurricanes began their development. Data is for the period 1950-2000. |
Hurricanes are seldom motionless after their initial formation. Typical paths of movement are displayed on Figures 7u-8 and 7u-9 for the various ocean basins that generate hurricanes. On average, hurricanes that form in the North Atlantic and North Pacific move in a west or northwestward path. In reality, the track taken by any individual storm is often very chaotic. Hurricanes can suddenly change both their speed and direction of travel.
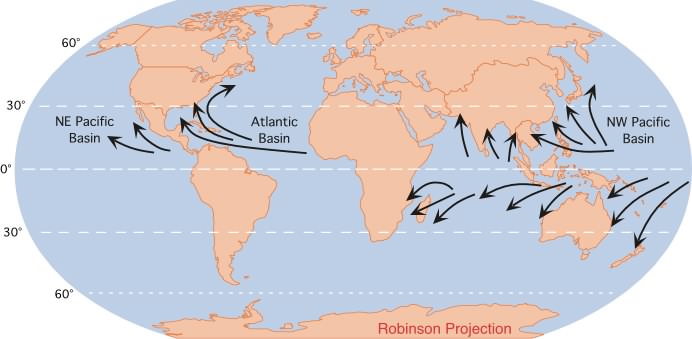
| Figure 7u-8: Typical areas where hurricanes begin their development and the common paths of storm movement. |
| Figure 7u-9: This map superposes the tropical storm tracks available from the National Hurricane Center and the Joint Typhoon Warning Center from the beginning of their records to September 2006. Colors associated with storm tracks indicate the intensity of the storm according to the Saffir-Simpsom intensity scale. Note the absense of storms in southeast Pacific and South Atlantic Oceans. Cool ocean currents keep sea temperatures from reaching temperatures needed for tropical cyclone development. (Source: NASA - Earth Observatory). |
Figure 7u-10 describes the annual number of hurricanes that developed in the North Atlantic, northeast Pacific, and northwest Pacific Ocean basins from 1951 to 2002. Of these three regions, the northwest Pacific Ocean basin produced the most hurricanes for this period, an average of 17.7 storms per year (Figure 8.36). The mainland of North America is often influenced by storms that form in the North Atlantic and northeast Pacific which produce a yearly average of 5.9 and 7.4 hurricanes, respectively. Most of the storms that form in the northeast Pacific travel away from North America out to open ocean (see Figure 7u-8).
| Figure 7u-10: Yearly hurricane numbers for the North Atlantic, northeast Pacific, and northwest Pacific Ocean basins for the period 1951-2002. Mean number of hurricanes for each ocean basin is displayed in red. |
Tropical storms and hurricanes also have very specific seasonal patterns. The peak season for these weather events in the Southern Hemisphere is January to March. In the Northern Hemisphere, most tropical storms and hurricanes develop in the months of June to November. Figure 7u-11 describes the month frequency of storm formation in the three ocean basins found in the Northern Hemisphere for the period 1951 to 2002. Each basin has slightly different patterns. Tropical storms and hurricanes rarely form during the months December to April in the North Atlantic and North Pacific basins. The Northwest Pacific basin has a significant number of storms forming in all months.
| Figure 7u-11: Combined tropical storm and hurricane monthly frequency for the North Atlantic, northeast Pacific, and northwest Pacific Ocean basins. Data is for the period 1950-2000. |
Hurricanes dissipate when the availability of latent heat energy is substantially reduced. This occurs either with landfall or storm movement into cooler seas. Most hurricanes live for about a week. However, if a hurricane remains over warm water its life can be extended. In 1992, hurricane Tina was an active tropical storm for 24 days over the North Pacific.
Hurricane Classification
The most commonly used system to classify the strength of hurricanes is the Saffir-Simpson scale (Table 7u-1). This classification scheme was developed so the public could quickly estimate the potential damage a hurricane’s winds and storm surge could have on a coastal area. The first two categories describe the two stages that occur before a storm becomes a hurricane: TD – tropical depression and TS – tropical storm. Hurricanes are categorized into 5 scales of intensity that ranges from 1 to 5. A major hurricane is considered to be category 3 and above.
Table 7u-1: Saffir-Simpson scale of hurricane intensity.
| Type | Category | Pressure (mb) | Winds (mph) | Winds (kmph) | Surge (meters) |
| Tropical Depression | TD | ----- | <> | <> | ----- |
| Tropical Storm | TS | ----- | 39-73 | 63-118 | ----- |
| Hurricane | 1 | > 980 | 74-95 | 119-153 | 1.2-1.5 |
| Hurricane | 2 | 965-980 | 96-110 | 154-177 | 1.6-2.4 |
| Hurricane | 3 | 945-965 | 111-130 | 178-209 | 2.5-3.6 |
| Hurricane | 4 | 920-945 | 131-155 | 210-250 | 3.7-5.4 |
| Hurricane | 5 | <> | >155 | >250 | >5.4 |
Figure 7u-12 describes the number of category 1 to 5 hurricanes that developed in the North Atlantic, northeast Pacific, and northwest Pacific Ocean basins for the period 1951 to 2002. Note that the northwest Pacific basin produces proportionally more major storms than the other two basins.
| Figure 7u-12: Frequency of Saffir-Simpson category 1, 2, 3, 4, and 5 hurricanes for the North Atlantic, northeast Pacific, and northwest Pacific Ocean basins. Data is for the period 1951-2002. |
Hurricane Damage and Destruction
Tropical cyclones are the most deadly and destructive type of severe weather event on our planet. One of the most destructive hurricanes in the last 100 years was the Bhola cyclone (category 3) that made landfall on the Bangladesh coastline on November 12 of 1970. This storm had a minimal pressure reading of 966 millibars and maximum sustained winds of about 185 km/hr. Estimates suggest that over 300,000 people died from this storm. Most of these deaths were caused by flooding due to the storm surge and heavy rains. The high death toll caused by this hurricane was due to lack of prepareness. It is believed that less than 1% of the population took shelter in fortified buildings. One of the deadliest Atlantic storms is hurricane Mitch (category 5). Hurricane Mitch encountered populated areas of Central America twice: in late October and early November 1998. Estimates suggest that over 11,000 people died from this storm. Most of these deaths were caused by flooding and mudslides due to heavy rains.
The damage that hurricanes inflict is caused by high wind speeds, heavy rainfall, storm surge, and tornadoes. Wind speed in a hurricane is usually directly related to atmospheric pressure (see Figure 7u-3 above). The lower the pressure the faster the winds blow. Wind speed also varies within the storm. As discussed earlier, winds are usually strongest at the edge of the hurricane's eye. High winds inflict damage by blowing down objects, creating choppy waves and high seas, and by inundating coastal areas with seawater. Rainfall within a hurricane can often exceed 60 centimeters (24 inches) in a 24-hour period. If this rainfall occurs on land, flooding often occurs. Storm surge is an increase in the height of the ocean's surface in the region beneath and around the eye of the storm. It occurs when low atmospheric pressure causes the ocean surface to expand and because the hurricane's cyclonic winds blow seawater towards the eye. Hurricane Camille (1969 – category 5) had a storm surge of more than seven meters (23 feet) with a central pressure of 909 millibars. A considerable amount of damage can also occur because of tornadoes. About 25% of the hurricanes that make landfall have associated tornadoes. Some scientists also suspect that the thunderstorms that occur near the eye of a hurricane can produce very strong downbursts (vertical downward movements of air).
The year 2005 was extremely bad for the development of tropical storms and hurricanes in the Atlantic Ocean. During the late summer and fall of that year, 28 tropical storms developed of which 15 became hurricanes. Table 7u-2 describes some of the characteristics of each of the storms that developed into hurricanes. Seven of the tropical storms and hurricanes made landfall in the United States causing more than 100 billion US dollars worth of damage. Katrina was the most destructive storm of the 2005 season causing over 81 billion dollars of damage. This hurricane made landfall at the mouth of the Mississippi River on August 29th and flooded 80% of New Orleans (Figure 7u-13). The strongest hurricane of the 2005 season was hurricane Wilma with a minimum storm pressure of 882 mb (Figure 7u-14). This is the lowest pressure reading ever recorded for the Altantic Ocean in modern times.
Table 7u-2: Characteristics of the Atlantic hurricanes of the 2005 season.
| Name of Hurricane | Born | Died | Lifespan | Maximum
Sustained Winds | Minimum
Storm Pressure | Damage in
US Dollars | Direct and
Indirect Deaths |
| Cindy | July 3 | July 7 | 4 days | 120 km/hr | 991 mb | 320 Million | 3 |
| Dennis | July 4 | July 13 | 9 days | 240 km/hr | 930 mb | 5 Billion | 89 |
| Emily | July 10 | July 21 | 11 days | 260 km/hr | 929 mb | 550 Million | 15 |
| Irene | Aug 4 | Aug 18 | 14 days | 165 km/hr | 970 mb | None | None |
| Katrina | Aug 23 | Aug 31 | 8 days | 275 km/hr | 902 mb | > 81 Billion | > 1836 |
| Maria | Sept 1 | Sept 10 | 9 days | 185 km/hr | 962 mb | 3.1 Million | 3 |
| Nate | Sept 5 | Sept 10 | 5 days | 145 km/hr | 979 mb | None | None |
| Ophelia | Sept 6 | Sept 23 | 17 days | 140 km/hr | 976 mb | 70 Million | 3 |
| Philippe | Sept 17 | Sept 24 | 7 days | 130 km/hr | 985 mb | None | None |
| Rita | Sept 18 | Sept 26 | 8 days | 285 km/hr | 895 mb | 10 Billion | 120 |
| Stan | Oct 1 | Oct 5 | 4 days | 130 km/hr | 977 mb | 2 Billion | > 1600 |
| Vince | Oct 8 | Oct 11 | 3 days | 120 km/hr | 988 mb | None | None |
| Wilma | Oct 15 | Oct 25 | 10 days | 295 km/hr | 882 mb | 29 Billlion | 63 |
| Beta | Oct 26 | Oct 31 | 5 days | 185 km/hr | 962 mb | None | None |
| Epsilon | Nov 29 | Dec 8 | 10 days | 140 km/hr | 979 mb | None | None |
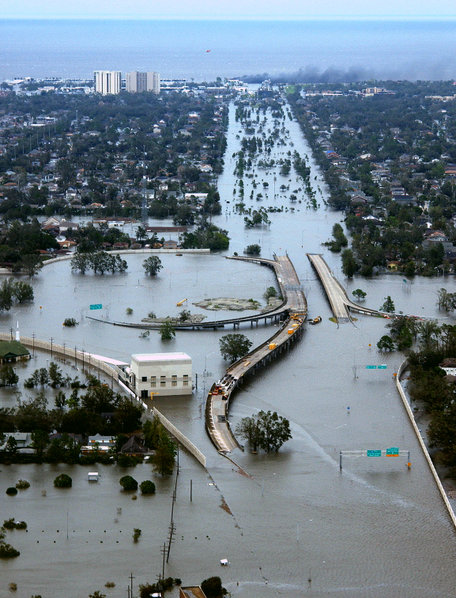
Figure 7u-13: Photo taken on August 29, 2005 in New Orleans, Louisiana showing Interstate 10 at West End Boulevard and looking towards Lake Pontchartrain. (Source: United States Coast Guard, photo taken by Kyle Niemi). |
Figure 7u-14: On the morning of October 19, 2005, the center of category 5 hurricane Wilma had a pressure of 882 millibars, the lowest pressure ever measured in an Atlantic hurricane. Wilma started its life on October 17th in the western Caribbean, southwest of the island of Jamaica. (Source: NASA - Earth Observatory).
(To view this animation your browser must have Apple's QuickTime plug-in and your monitor should be set for thousands of colors. The QuickTime plug-in is available for Macintosh and Windows computers and can be downloaded from the World Wide Web site www.apple.com/quicktime.)
Typhoons in the Philippines

Typhoons in the Philippines describes the most notable tropical cyclones to enter the Philippine Area of Responsibility and affect the Philippines. Bagyo is a term referring to any tropical cyclone in the Philippine Islands. An average of 6 to 7 tropical cyclones hit the Philippines per year. A bagyo is categorized into four types according to its wind speed by the PAGASA. All tropical cyclones, regardless of strength, are named by PAGASA. Tropical depressions have maximum sustained winds of between 55 kilometres per hour (30 kn) and 64 kilometres per hour (35 kn) near its center. Tropical storms have maximum sustained winds of 65 kilometres per hour (35 kn) and 119 kilometres per hour (64 kn). Typhoons achieve maximum sustained winds of 120 kilometres per hour (65 kn) to 185 kilometres per hour (100 kn), with super typhoons having maximum winds exceeding 185 kilometres per hour (100 kn). The most destructive tropical cyclone to impact the Philippines was Tropical Storm Thelma in 1991, which killed thousands of people from its resultant flooding. The wettest known tropical cyclone to impact the archipelago was the July 1911 cyclone which dropped over 1,168 millimetres (46.0 in) of rainfall within a 24 hour period at Baguio City. At least 30 percent of the annual rainfall in the northern Philippines could be traced to tropical cyclones, while the southern islands receive less than 10 percent of their annual rainfall from tropical cyclones.
Bagyo
The term bagyo, a Tagalog word meaning Typhoon arose after a 1911 storm where a record rainfall of 46 inches occurred in the city of Baguio in one 24 hour period.
Variability in activity
The most active season, since 1945, for tropical cyclone strikes on the island archipelago was 1993 when seventeen tropical cyclones moved through the country. There was only one tropical cyclone which moved through the Philippines in 1958. The most frequently impacted areas of the Philippines by tropical cyclones are northern Luzon and eastern Visayas. A ten year average of satellite determined precipitation showed that at least 30 percent of the annual rainfall in the northern Philippines could be traced to tropical cyclones, while the southern islands receive less than 10 percent of their annual rainfall from tropical cyclones.
Most destructive

![]()
Thelma approaching the Philippines
| Most destructive typhoons in the Philippines | ||||
| Rank | Storm | Dates of impact | Deaths | Damage |
| 1 | November 2-7 , 1991 | 5,101-8,000 | P 1.045 B | |
| 2 | October 30-November 4, 1995 | 936 | P 10.829 B | |
| 3 | November 10-14, 1990 | 748 | P 10.846 B | |
| 4 | October 11-15, 1970 | 768 | P 1.89 B | |
| 5 | November 3-6, 1984 | 895 | P 1.9 B | |
| 6 | October 15-24 1998 | 303 | P 6.787 B | |
| 7 | November 23-27, 1987 | 979 | P 1.119 B | |
| 8 | September 30-October 7, 1993 | 576 | P 8.752 B | |
| 9 | December 6-19, 1951 | 991 | P 0.7 B | |
Wettest recorded tropical cyclones
Main article: List of wettest tropical cyclones by country

![]()
Typhoon Mindulle/Igme
| Wettest tropical cyclones in the Philippines
| ||||
| Precipitation | Storm | Measurement
| ||
| Rank | (mm) | (in) | ||
| 1 | 1168.4 mm | 46.00 inches | July 1911 cyclone | Baguio City |
| 2 | 1085.8 mm | 42.45 inches | Baguio City | |
| 3 | 1012.7 mm | 39.87 inches |
| |
| 4 | 994.6 mm | 39.16 inches | Baguio City | |
| 5 | 817.9 mm | 32.20 inches | ||
| 6 | 723.0 mm | 29.46 inches | Tondoligan(Park),Dagupan,Pangasinan | |
| 7 | 747.0 mm | 29.41 inches | John Hay AB | |
| 8 | 685.0 mm | 26.97 inches | Baguio City | |
| 9 | 580.5 mm | 22.85 inches | Tongonon Geothermal Site | |
| 10 | 523.5 mm | 20.61 inches | ||
See also
- 2009 Pacific typhoon season
- 2010 Pacific typhoon season
- List of Pacific typhoon seasons (1939 onwards)
References
- ^ a b c d Glossary of Meteorology. Baguio. Retrieved on 2008-06-11.
- ^ Joint Typhoon Warning Center. Appendix B: Characteristics of Tropical Cyclones Affecting the Philippine Islands (Shoemaker 1991). Retrieved on 2008-04-20.
- ^ Atlantic Oceanographic and Meteorological Laboratory, Hurricane Research Division. "Frequently Asked Questions: What are the upcoming tropical cyclone names?". NOAA. http://www.aoml.noaa.gov/hrd/tcfaq/B2.html. Retrieved 2006-12-11.
- ^ National Weather Service (September 2006). "Hurricanes... Unleashing Nature's Fury: A Preparedness Guide" (PDF). NOAA. http://www.srh.noaa.gov/fwd/wcm/hurric.pdf. Retrieved 2006-12-02.
- ^ Bouchard, R. H. (April 1990). "A Climatology of Very Intense Typhoons: Or Where Have All the Super Typhoons Gone?" (PPT). http://www.usno.navy.mil/NOOC/nmfc-ph/RSS/jtwc/pubref/References/where_have_all_the_super_typhoons_gone.ppt. Retrieved 2006-12-05.
- ^ a b c d Leoncio A. Amadore, Ph.D. Socio-Economic Impacts of Extreme Climatic Events in the Philippines. Retrieved on 2007-02-25.
- ^ English, Fr. Leo James (2004, 19th printing), Tagalog-English Dictionary, Manila: Congregation of the Most Holy Redeemer, p. 117, ISBN 971-08-4357-5
- ^ Philippine Center for Language Study; Jean Donald Bowen (1965), Jean Donald Bowen, ed., Beginning Tagalog: a course for speakers of English (10 ed.), University of California Press, p. 349, ISBN 9780520001565, http://books.google.com.ph/books?id=rr_b8y_B0EsC
- ^ Joint Typhoon Warning Center (1994). "1993". United States Navy. http://www.usno.navy.mil/NOOC/nmfc-ph/RSS/jtwc/atcr/1993atcr/pdf/1993.html. Retrieved 2008-11-09.
- ^ Joint Typhoon Warning Center (1959). "1958". United States Navy. http://www.usno.navy.mil/NOOC/nmfc-ph/RSS/jtwc/atcr/1958atcr/pdf/1958.html. Retrieved 2008-11-09.
- ^ Colleen A. Sexton (2006). Philippines in Pictures. Twenty-First Century Books. ISBN 9780822526773. http://books.google.com/books?id=ffGdShrIrQAC&pg=PA15&lpg=PA15&dq=most+active+typhoon+season+for+the+philippines&source=web&ots=JQck52fPts&sig=PE_ckmzTSjVSzPPCce5zMjPnj-w&hl=en&sa=X&oi=book_result&resnum=6&ct=result#PPA2,M1. Retrieved 2008-11-01.
- ^ Edward B. Rodgers, Robert F. Adler, and Harold F. Pierce. Satellite-measured rainfall across the Pacific Ocean and tropical cyclone contribution to the total. http://ams.allenpress.com/perlserv/?request=display-figures&name=i1520-0450-39-10-1658-f02. Retrieved 2008-11-25.
- ^ Typhoon2000.com..::10 WORST TYPHOONS OF THE PHILIPPINES (A SUMMARY)..::
- ^ a b Padgett, Gary; Kevin Boyle, Huang Chunliang, and Simon Clarke (2006-10-26). "Monthly Global Tropical Cyclone Summary June 2004". Australian Severe Weather Index. Jimmy Deguara. http://australiasevereweather.com/cyclones/2004/summ0406.htm. Retrieved 2007-01-13.
- ^ Joint Typhoon Warning Center. Typhoon Elaine. Retrieved on 2007-02-25.
- ^ "JTWC Annual tropical cyclone report: 2003". Joint Typhoon Warning Center. 2004. http://www.usno.navy.mil/NOOC/nmfc-ph/RSS/jtwc/atcr/2003atcr/2003atcr.pdf. Retrieved 2010-01-22.
- ^ 1989 Northwest Pacific and North Indian Ocean Tropical Cyclones. Retrieved on 2007-03-14.
- ^ David Roth (2009). Tropical Cyclone Rainfall Maxima. Hydrometeorological Prediction Center. Retrieved on 2007-03-15.

No comments:
Post a Comment